
Willem Toet explains…CFD Post Processing. Part 3
Welcome to last of the three-part series by former Head of Aerodynamics at Benetton, Ferrari and Sauber F1, Professor Willem Toet, who exclusively explains CFD Post Processing in depth.
Part 1 here
Part 2 here
Record Your Work
We’ve all done it. Short cut the paperwork to do some new analysis and make a decision. Then a week later with another few hundred cases down the line you’ve forgotten why you made a particular decision. Write logical reports – it will help you in the future and help you to hand over a project or project intellectual property. To go back and fill in the blanks later is far less efficient. During the process of writing your report you will be “forced” to think again about your decisions – to justify them if you like.
For CFD cases related to cars, here is a starting suggestion. For each and every geometry you test – write a few lines and explain what you’ve done and what you’ve learned. Even mistakes and unexpected results teach you something.
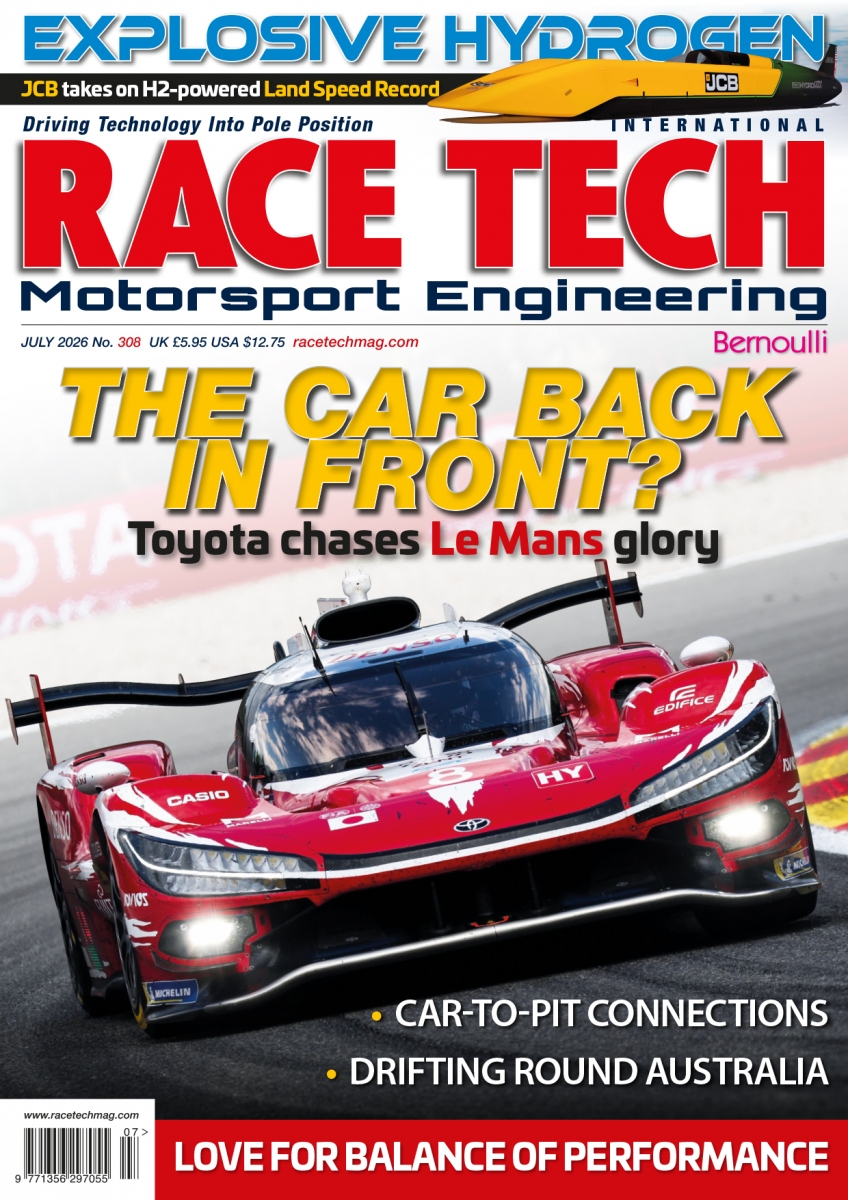
Below I give an overview image of what a single run might look like in a report.
90. This shows an arrangement of information that I feel is reasonable – but of course you can’t see much detail this way. The report should include the following information: –
A description of the purpose and expectations of a test (and relevant information about the baseline for the test)
Setup information and forces / relevant values for the baseline and for the test Delta forces / values seen due to the change made (F1 teams add hundreds of incremental gains to make a package – big steps like this one are rare)
Images and words to describe what the test means – e.g. what is the conclusion, where did something change, why – do you understand the mechanism
Next steps if any
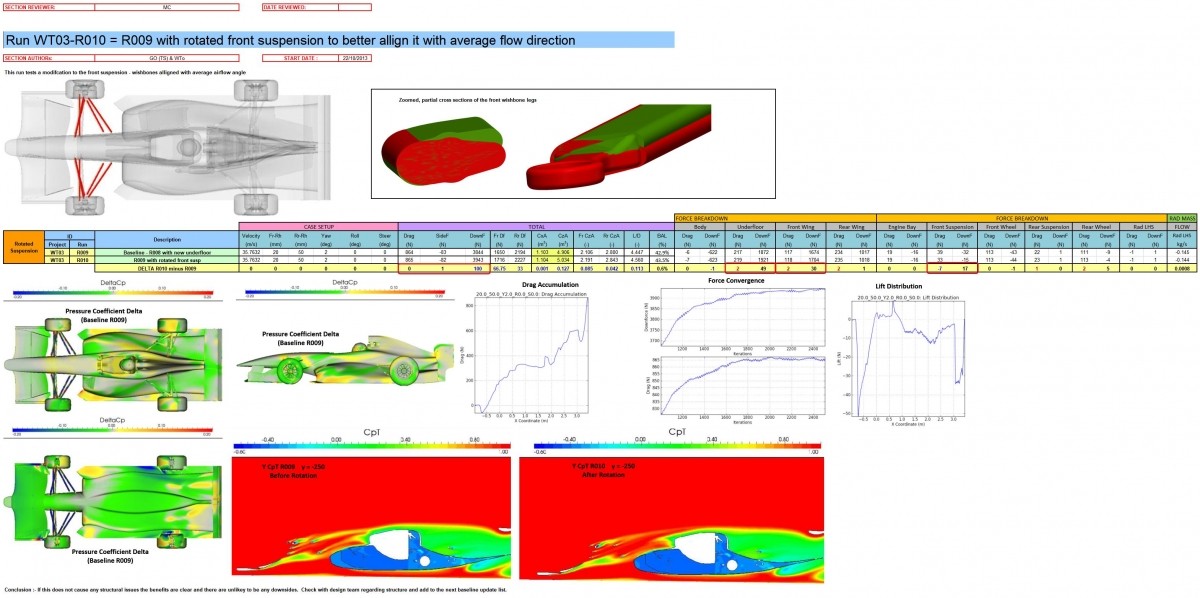
92. The idea of this part of the report is to give the reader a clear mental picture of change that has been made. What you show will change significantly depending on what is changed. Here, the title says what has changed. In this case the teardrop-shaped wishbone legs of the front suspension have been rotated to an angle that is more in line with the average airflow (around them). The image of the car has the wishbones coloured in red to indicate that this is the area that has changed. The first cross section includes a small local bulge for the thread of a bolt in joint. The red is intended to be the old design (removed), the green the new (added). In this example, more text could be used to describe the change.
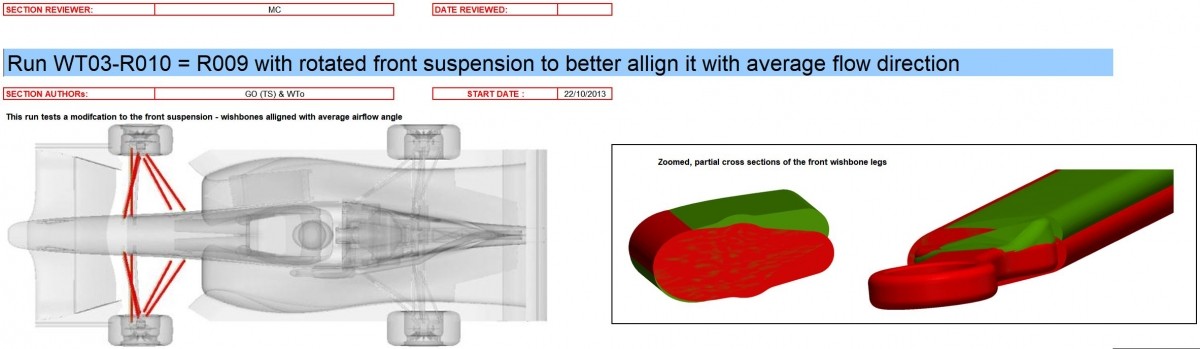
93. Useful setup and run identification information. It will help you a lot if you give your CFD runs unique code numbers. The more the code makes sense to you, the more you can follow what is happening. For example, with the project “WT” means customer Willem Toet, “03” means 3rd project from that customer, R009 means run 9 from this series of tests. If you know you will do thousands of runs, you’ll need a longer run number. Then descriptions. In this case the descriptions for both the baseline and the test item could have been thought about more. For run “WT03 R010” it would have been better to write something like “as R009 with front suspension legs rotated to 10 degrees nose down (were at 0 degrees)”. This would take more space and risks being partly hidden by the next cell, but would convey more information that is likely to become important. Making the comments make sense is a critical skill to learn – you need to communicate to the next person and it does not matter if you remember / understand – if they don’t then you have not communicated well enough. I have found myself gently trying to “educate” some very experienced people – so please step back and think.
Then the CFD setup information that can be changed during runs in the sequence such as ride height and other attitude parameters, car “speed” etc. Think about what might be changed when you set up the template (I used Excel here).
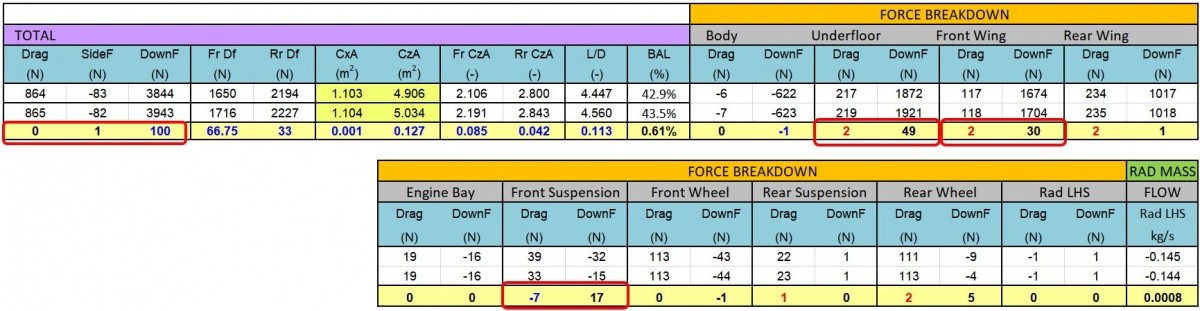
95. An assembly (in the picture) of the remainder of the numerical information. Your project may well need something different but consider having overall values (resolved at the contact patches for a car, train, motorbike etc.) of drag, side and downforce. Be aware of the frame of reference for these. This is argued about even in F1. I resolve in car fore/aft direction about the contact patches, some people resolve around wind direction. Either can work – the forces acting on the vehicle/body are the same in the end – the rest is just a bit of maths. You will notice that we don’t use a huge number of decimal places (significant digits). Not much point displaying to great accuracy when the convergence and repeatability suggest that won’t be real.
Shown also are front and rear downforce, “coefficients” of drag and downforce, front and rear downforce, efficiency and balance. When I say “coefficients” it is common and easy to use the coefficient multiplied by area. Saves bothering to calculate the area – which will change with virtually every run you do. In many research fields a nominal area is used and that number is not changed.
Cd.A is a nicer way to express the coefficients. Then the main force directions (drag and downforce) are broken down into various areas of the car and radiator flow is also calculated. This early iteration of the design had negative flow backwards. We gave a young engineer some space and he learned a lot. Just imagine if we had not bothered to measure this in the CFD case! I’ve been there – a boss bought a Le Mans car from a factory team and the cooling didn’t work! Was easy to “fix” though. Needed some help from an aero expert.
As well as the breakdown for each configuration a difference line is calculated. Note that colours are used to show if something is better or worse. This result is a rare clear one. Same drag, more front and more rear downforce. Front suspension lift is reduced, front wing and floor downforce improved.
Perfect! Don’t expect this all the time!!
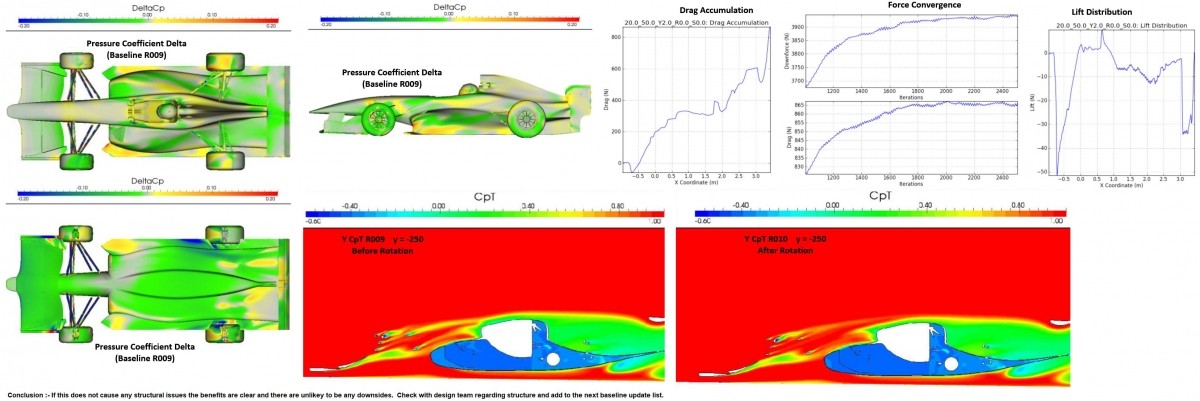
96. Near the numerical data. I like to show a few images that demonstrate something useful about the case or the change that has been made. This might be a delta plot, a convergence history, a cross section. Whatever you show should be relevant for the report or should add some value. Here I show drag accumulation and lift distribution (in the standard X direction) as two of the plots. I find other plots of a similar ilk but sideways to be useful too. Now, I have given a lot away – here I hold a bit back.
If you’re bright and have done some serious analysis of your own first – then perhaps we can have a chat about why that might be important for a vehicle. Here is another key skill to learn – find the best concise way to communicate the most important aspects of the result – explain the mechanisms at play. Thanks again to TotalSim.
Repeatability and Incremental Gains
Think a bit also about the repeatability of your results. There are many ways of doing this. One is a very fine ride height or yaw angle sweep with complete remeshing between steps. You will get a performance curve that isn’t smooth. Deviation from the curve is your best-case repeatability. Smaller steps than that may be a step in the opposite direction to the direction you think but suffer from errors caused by your method. A mesh sensitivity study is also a must if you are to convince other people that you have understood the strengths and limitations of your method. In F1 we have not reached full mesh independence even at a billion really high quality, intelligently created cells. None the less understanding the interaction is an essential step in your understanding.
Another word of caution… CFD has been brilliant for teaching a deeper understanding of airflow and the mechanisms at play, particularly with complex flow schemes. That’s its strength. Most CFD done when one is learning is “approximate” at best. So, think about the limitations not only of the method but also of the particular attitudes you’ve picked to do your analysis. Below is an example of why you need to stay mentally awake.
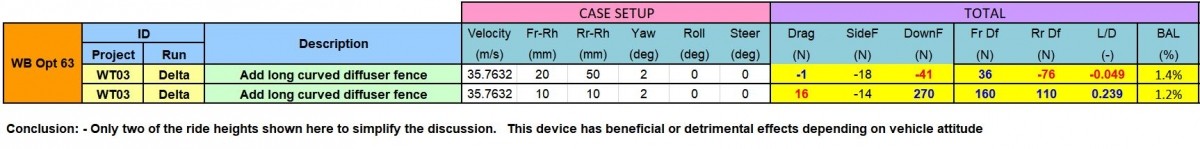
98. This example is the delta effect of adding a diffuser fence at two different vehicle attitudes (heights). At one attitude downforce (at the rear) is lost. At the other downforce is increased. Often students (e.g. in Formula Student) argue that they are sure they have found performance using single attitude research. Best to maintain a hint of humility. We’ve all been humbled by facts we’d forgotten to consider, and some of us have been playing at this game for a long while (that means we’ve made more mistakes than you). One learns from these mistakes.
Aero forces on cars change and can change a lot. Think about your worst-case scenario. What happens when the car is accelerating (high front, lowish rear), when the front is “on the ground” in braking, when the driver gets carried away and has the rear sliding wildly sideways. These are real situations.
If you are doing Formula Student / SAE, look at the real attitudes of the car from last year, think about wind speed vs. car speed and imagine a worst case of wind and yaw in “skid pan”. Map your baseline and occasional intermediate steps in those attitudes. Work with the vehicle dynamics team and calculate the overall “balance” of the car when you combine mechanical and aero forces.
When you think about correlation – and I sincerely hope you do, then consider carefully what you can and what you cannot measure in the wind tunnel or on the roads / tracks with your vehicle or object.
If you compare to a race car, with forces measured using push rods (or pull rods, damper load cells etc), remember that, a car on track generally does not tell you about wheel or outboard suspension vertical loads. They act directly through the tyres and are not “seen” by the force measurement systsm. CFD though, can measure, and isolate these forces. So you can, both, get a more complete answer and have information to correlate to what is measured by the race car.
CFD and your Aero project
If you can afford to, take the first steps into this fascinating field of engineering, then please have a go. Get as much information as you can and remember to push the experts to explain as much as possible so you learn as much as you can for yourself. With time and experience, you will be able to take some real understanding from our delicious ‘black art’. Actually, we’ve been fooling the world for a long time, as it is just another branch of engineering that is mostly understandable. You just have to be aware that there are many steps and that flow can be complex.
Most of this article has focused on post-processing and the images have come almost exclusively from RANS calculations. A conscious choice. Not everyone has the resources to do unsteady calculations. Some comments from Torbjörn Larsson: “Here we are only considering steady state RANS I guess. I dońt know how deep you want to go here (it can easily become a can of worms), but perhaps you could elaborate a bit on the pros and cons with RANS vs time-resolved CFD. When it comes to making decisions based on RANS results it is important to understand some of its limitations and underlying assumptions. For example; while we are looking at integrated forces acting on surfaces we don’t have any true information on the actual amplitudes/variations. The max instantaneous force may be significantly higher (particularly when we have shedding wakes).
“Predicted off surface structures (e.g. vortices) positions are an average and we do not really know much of the spatial envelope. Or, even worse, some structures may just be an artefact of the RANS averaging and don ́t even exist in real life.
“This may be a bit over the top, but I’ve spent plenty of time analysing wings over the years trying to optimise the performance (efficiency or downforce) and the fact that most RANS methods cannot, with confidence, predict (and account for) boundary layer turbulence transition is a limitation. I think one needs a lot of experience to get this right while approaching CzMax conditions.
“Regarding standard plots. One thing I always try to do is to include some basic plots/images that quickly would reveal if e.g. some boundary conditions have not been set properly or not behaving as expected (e.g. wheel rotations, ground plane, far field conditions, pressure drop over heat exchangers, porous zones, mrfs). And on that topic, always check for overall mass conservation in the computational domain.”
I have not been able to be comprehensive with this article. However, if experts out there have suggestions about things that I should include here, I would be interested to discuss them. No doubt the article will evolve as a result. To be honest, it may have been better to start with a starter article – where to begin with CFD, but too late now and I’ll tackle that one another day. Have fun learning!!
Further food for thought
- Isolate each geometrical change – combinations often don’t add up so work out what works with what
- Learn to distinguish between cause and effect
- Think critically – question your results – if something is too good to be true it probably is just that – be sceptical and check
- Flow instabilities and “flip flops” in the flow – don’t allow them – they will cause you problems – understand where they come from and eliminate them
- Data mining may play a part in the next step of CFD (multi case) analysis – e.g. find all the modifications that increase total pressure in a certain region (a region you’re interested in
exploiting in the near future for example) – see example below
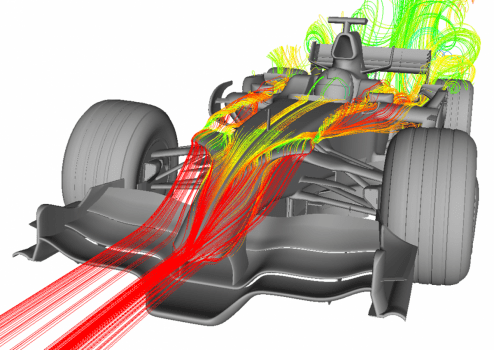
99a. When you are chasing maximum downforce, it is really upsetting (as the boss of an aero group) to see air passing straight through your beloved car doing (nearly) nothing. This thought led to flow lines being traced forward from the area of high energy air behind the car. This is already an evolution.
Several people then started working on a device that would deflect air so that we could use it to generate downforce.
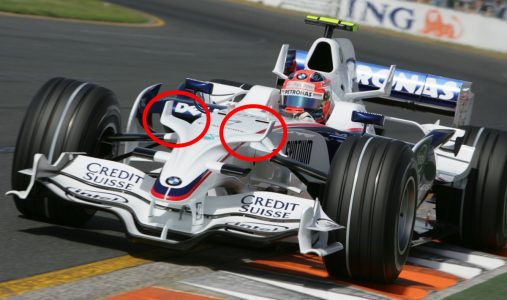
99b. The “TomCat” devices (circled) were the result of looking indirectly for devices that would allow the team to create more downforce. A key player in this development was “Tomo”, hence the TomCat unofficial name for these devices. These devices moved more air into places that allowed rear downforce to be created (further back).
Next steps
There are so many I have had to draw a line. An important one will be tricks for postprocessing transient simulations. Now that’s going to be fun to write! I probably need to address pre-processing first though!
Thanks
Special thanks to Rob Lewis and the helpful team at TotalSim (past and present), to Torbjörn Larsson of Creo Dynamics, Riccardo Pagliarella of AeroONE Australia, Sauber Aerodynamics Ltd and RaceTech Mag for hosting the post.
More posts from me on RaceTech Mag and on LinkedIn